Getting My Feet Wet

The first project we were required to complete for the Data Analyst Nanodegree (DAND) was one that asked us to examine trends in global temperatures. This introduced us to the use of SQL, asked us to graph results in Excel, and display the results and analysis in a report. Perhaps the part that I enjoyed most about this project was getting confirmation that the data analysis skills that I had developed, many just as my intuition led me in the course of my work, was on track with what was typically done. It was encouraging to realize that my self-taught skills WERE relevant in the formal world of data analysis.
If you'd like to see the full details of the project, including the statistical analysis used to confirm the observations, you can check it out in it's repo, but I'll go through some of the highlights here.
Comparing Canadian Temperature Changes to Global Changes
Temperature Changes Over Time for Six Canadian Cities & the Globe
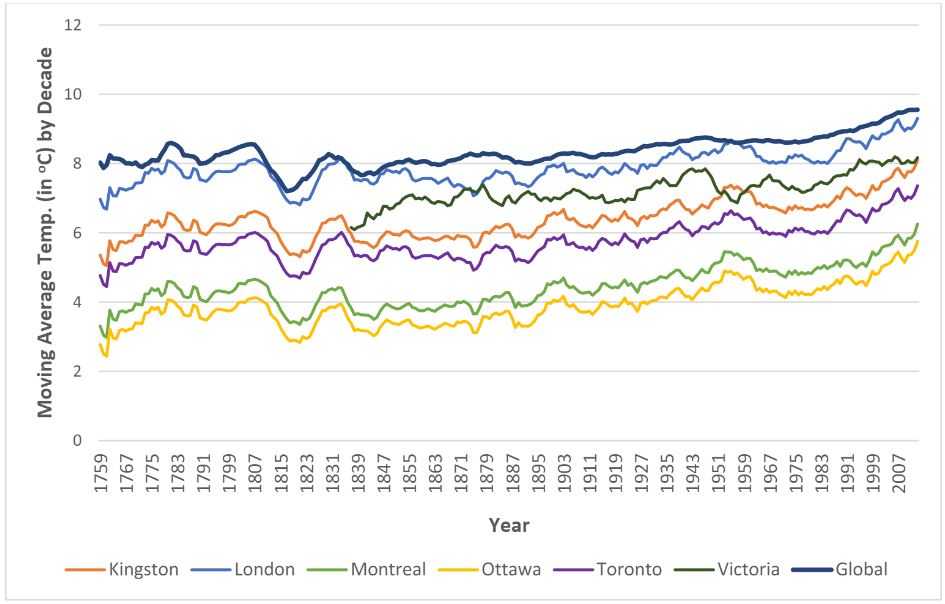
The graph shows a general trend of increasing temperatures for the time period show. Close inspection also shows that the patterns in temperature variation for Victoria are substantially different than those of the other five Canadian cities.
Geography Influences Temperature Variations Between Cities
Map of Canada
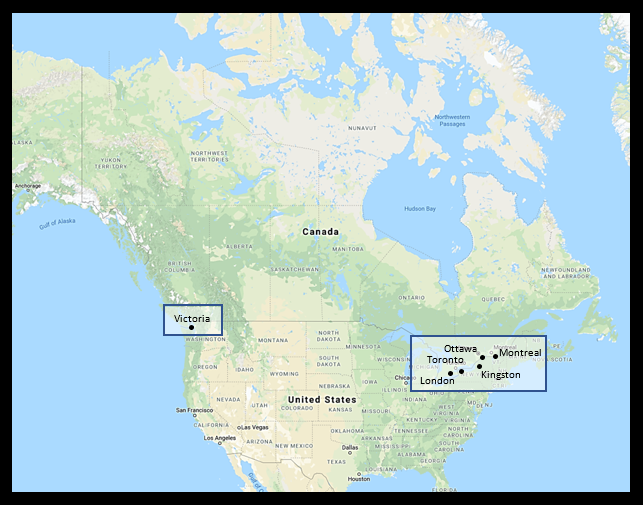
As can be seen on the above map, the city of Victory is found on an island just off the west-coast of Canada. The other five Canadian cities are all located on the eastern side of Canada, relatively close to the St Lawrence River or Lake Ontario.
Conclusion:This suggests that geographic proximity and location influence temperature variations found within Canadian cities.
Canadian Cities are Colder than the Global Average
The influences of geography can also be seen when comparing the average temperatures for the Canadian cities to the global temperatures. Canadian cities have lower temperatures than the global temperatures as a result of their common latitude. The Canadian cities had latitudes ranging from 43N to 48N - reasonably above the equator.
Conclusion:These findings are expected because global temperatures include temperatures from warmer climates that are closer to the equator, increasing the average.
Global Temperatures Strongly Correlate With and Predict Global Temperatures
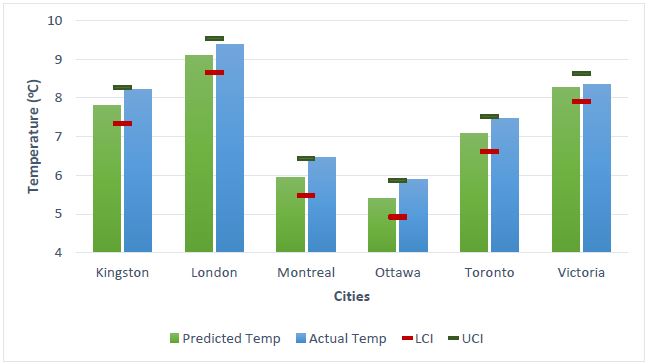
2014 Temperature Predictions
2015 Temperature Predictions
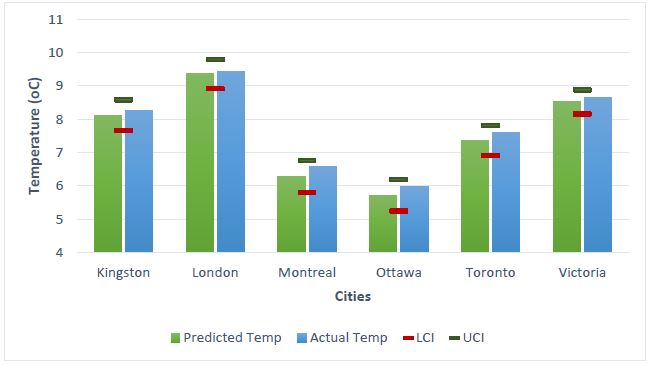
Although geography has a clear influence on city temperature trends and variations, what may be less clear from the original graph is how these interact with changes in global temperatures. Regression was used to predict the temperatures for the cities from the global temperatures at a 95% confidence interval. This was then compared to the actual temperatures for those years. Even though it wasn't possible to confirm that the methodology for calculating the temperatures in the dataset was the same as what was retrieved from online, their were strong predictive capabilities. The only two predictions that did not fall within a 95% confidence interval were Montreal and Ottawa in 2014.
Conclusion:As global temperatures change, cities see a corresponding impact on their local temperatures.
Global Temperatures Have Seen a Sharp Increase Since 1980
Global Temperature Changes Over Time
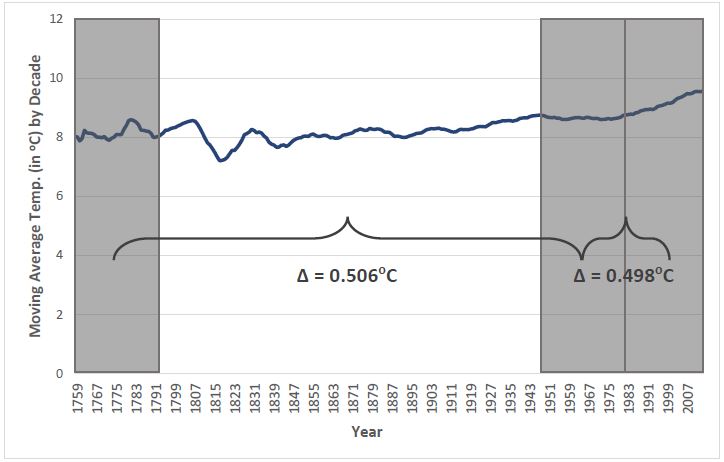
If 1980 is taken as a starting point, and the following 35 years are compared to the 35 years, before 1980, there is an average change in global temperatures of about 0.5C. This is similar to the amount of change in temperatures for the 150 years prior to that.
Conclusion:The trend in global temperatures is one of substantial increase and it is expected that these changes will also be seen at the city level.