Learning Python

This is honestly what learning to code sometimes feels like - trying to navigate twists and turns of a brand new language, while other people sit around and have opinions. ;) As I've said before, I started the Data Analyst Nanodegree (DAND) with very limited coding experience. The second project for the DAND was a Python project. We were provided a dataset about the use of the Bikeshare program (with one of the original csv files having more than six million lines of data!). Our job was to create a program that could take user input to filter the results and display a number of specified use statistics.
You can check out the original project and the code in its repo branch,
the updated project (overhauled to use pandas), and a walk-thru of the code functionality.
I'll provide some highlights of insights from the data below.
Overview
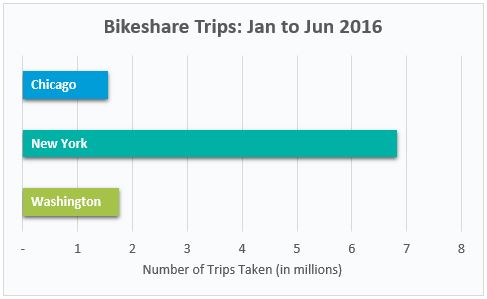
Total Trips
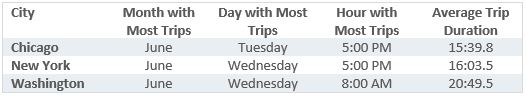
Trip Information
Observerations
- June has the most trips compared to any other month for all cities. This suggests that bikeshare use may be linked to temperature or favorable cycling conditions.
- Bikeshare use seems to align with commuter patterns, with most common trip start times aligning with the typical days and times for journeying to and leaving work.
- Washington commuters appear to have somewhat different use patterns with more trips taken in the morning and a longer average trip time.
Monthly Use Patterns
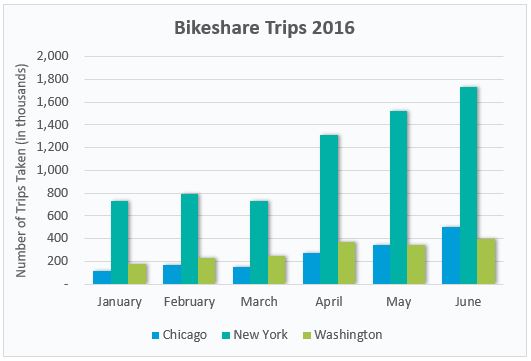
Observerations
Examination of the use patterns by month continues to support the suggestion that bikeshare use increases with more favourable weather conditions. Each city shows a trend of increasing use with the arrival of spring to summer months.
Commuter Patterns
Days of the Week
The data for each month for each city was run to identify the most popular day for bikeshare trips each month.
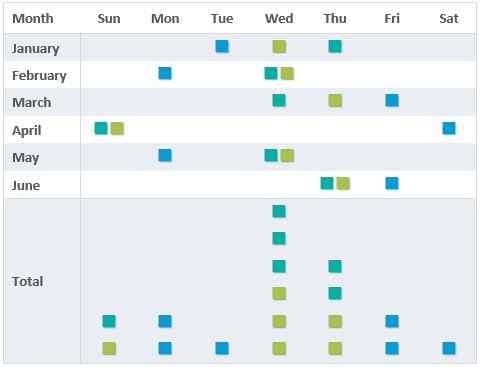
Observerations
- Across all cities, the most popular days for bikeshare use were Wednesdays and Thursdays.
- Bikeshare patterns were similar for New York and Washington, with both tending to having either Wednesday or Thursday as the most popular day in the month, except for April.
- The most popular days for Chicago were Mondays, Tuesdays, Fridays and Saturdays, with the most popular weekday changing each month.
- Each city had a weekend day, instead of a weekday, as it's most popular day during April. This may have been impacted by spring break.
Start Time
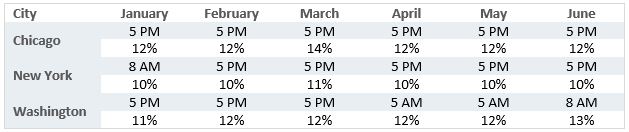
Observerations
- When examined per month, start times continue to show preference for peak commuter times, particulary going home. This may be due to commuters being more rushed in the morning and choosing faster options at this time.
- Bikeshare use appears to be relatively spread, with the most popular hours only accounting for 10-13% of available hours. (While equal distribution would be 4%, very limited use is expected from 9pm to before 5am)
- Washington shows the greatest variability in popular start time, including quite early start times of 5am.